How to create and implement Financial Periods in PrimaveraP6
Do you want to know more about the financial periods and improve your contribution to the management and control of construction projects? Financial periods are a valuable feature of Primavera P6 and play a pivotal role in project control and the validity of BI dashboards. The purpose of this article is to demonstrate how the financial Period feature can be utilized in Primavera P6.
This is what the P6 help function says about Financial Preriods!
P6 Professional enables you to define your organization's global financial period calendars in the Financial Period Calendars dialog box.
Customized financial periods provide a more accurate display and reporting of actual units and costs. Rather than spreading costs evenly throughout the length of a project, users can view how actual costs were incurred by customized financial periods.
If your organization always updates the schedule according to the same time interval (for example, every week, every month, every quarter, etc.), you can quickly create a calendar and add a batch of financial periods to it.
If the schedule may be updated irregularly, you can create a single financial period for any financial period calendar at any time.
In many contracts I have worked on, the updating of the schedule was on a weekly basis for the reporting of the progress of a project.
However, at the end of the financial period, every four weeks, a monthly progress report is to be established and reported to the board of directors, the project sponsor, and possibly the owner.
This article is not intended to judge the need or usefulness of the feature but to demonstrate this practical application.
Where to start?
To apply the financial period feature, we have two steps.
- Step one is to create the financial periods and
- Step two is to apply the financial period.
However, we start with the creation of an example network.
Let's start with an example.
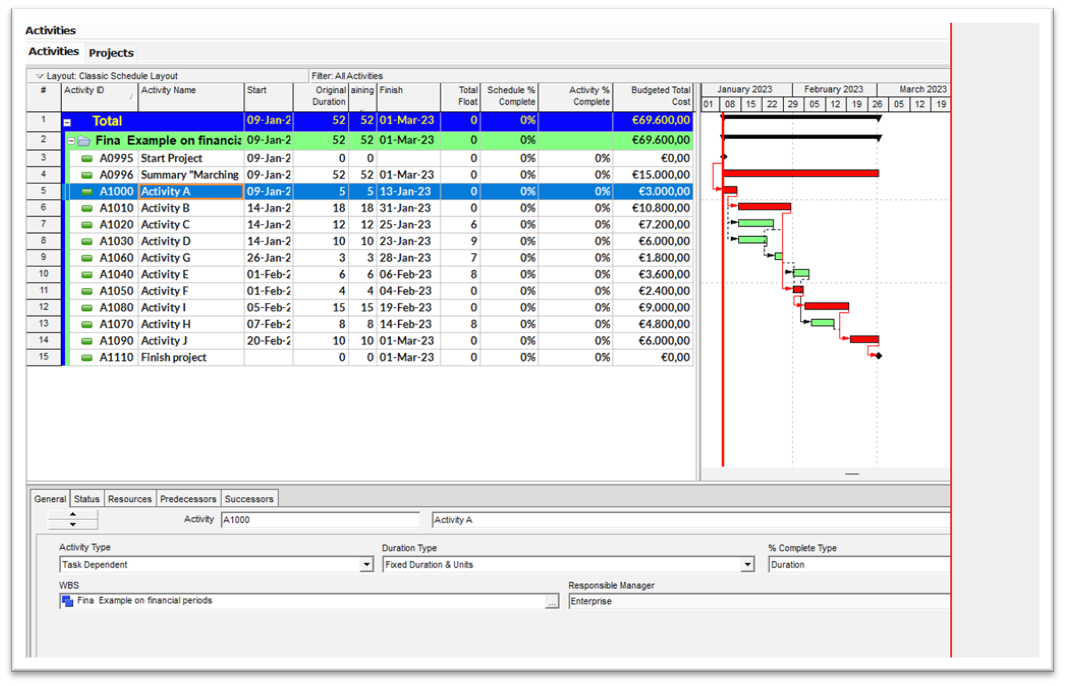
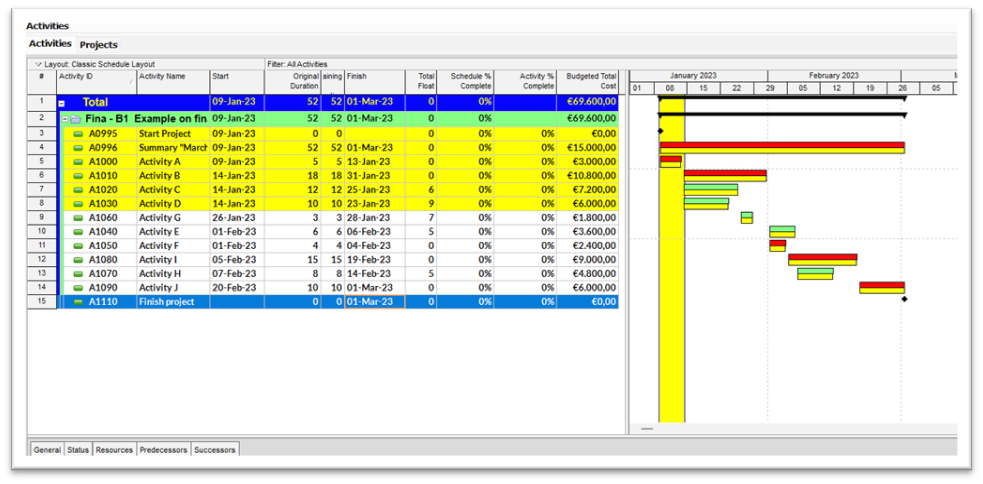
Here, we see small network planning. The project consists of fifteen activities, and these are connected with dependencies and cost-loaded with a total amount of budget of 69.600,00 euros.
Now we have baselined the project, and that looks like this.
Step one is to create the financial periods in P6
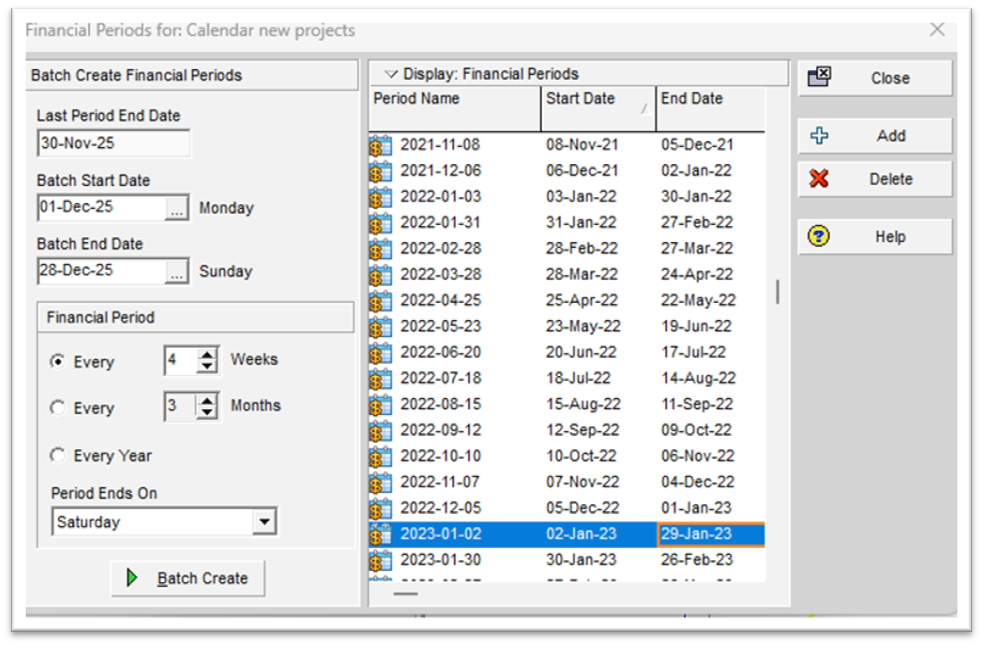
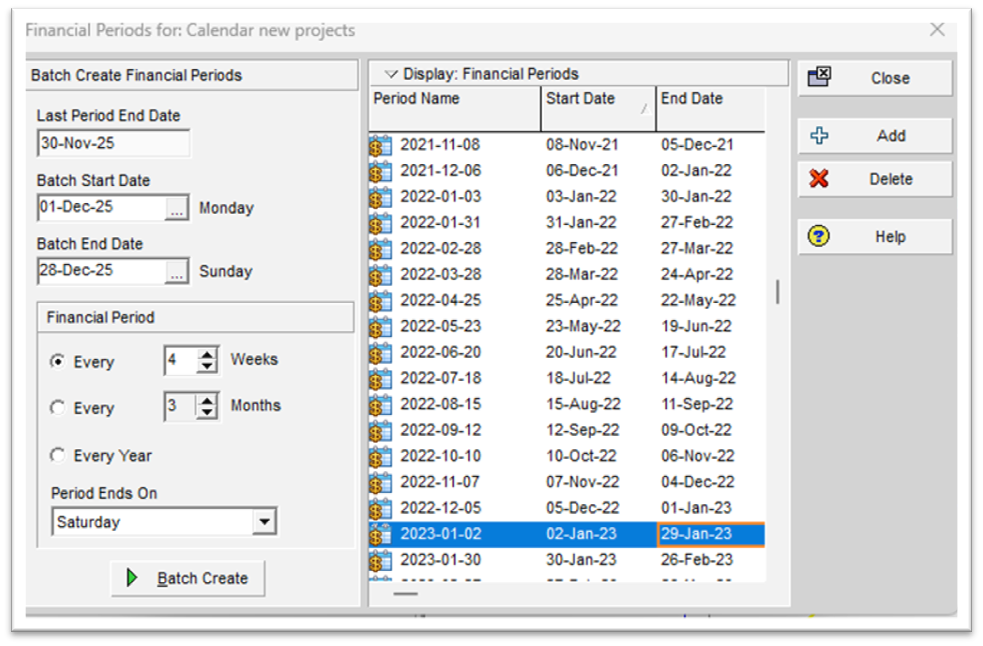
To create the financial periods in P6, you must go to the admin tab, select “Financial Period Calendars,” and make the calendar for your project or company, as demonstrated in the picture below.
Step two is to create the financial periods Calendars.
As you can see, I have a large number of periods, and I have chosen to use the four-week period, the period ends on Saturday. You can make the financial periods as its’s suit your project and your organization. Specialists in monitoring and controlling costs are primarily interested in the four-weekly or monthly reports. Planners and schedulers may like more the weekly or the bi-weekly periods.
Step three is to apply the financial period.
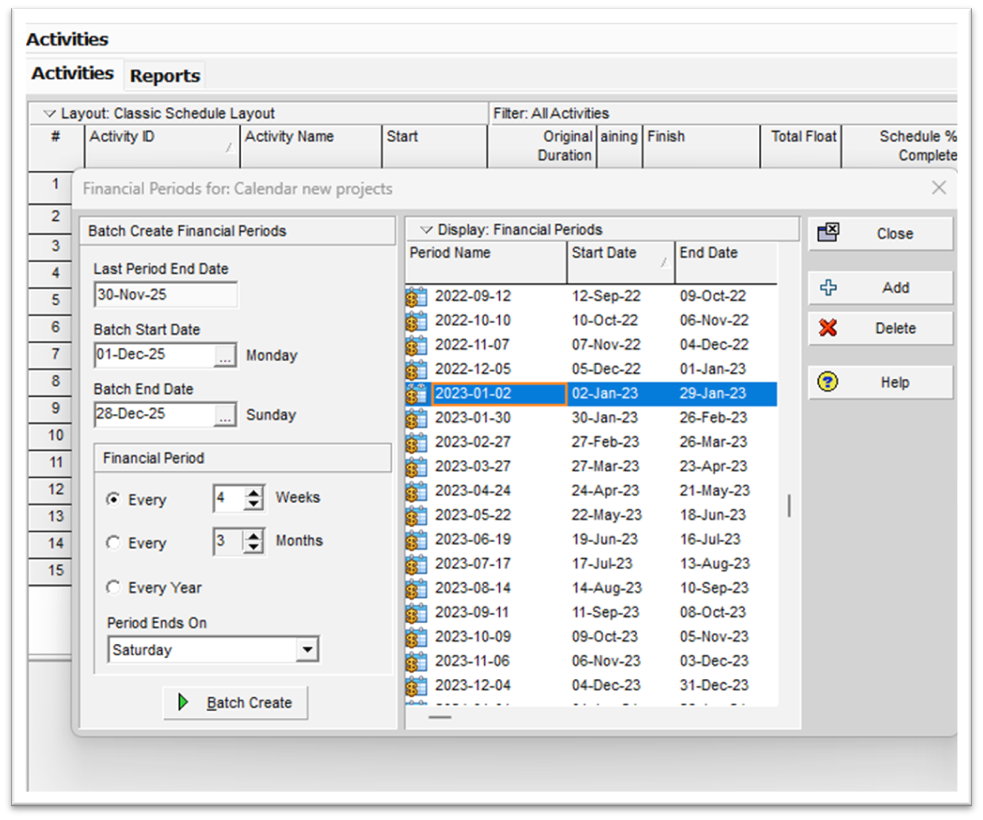
So, we have cleared step one, and now we go to step two. This step is to go back to the project schedule, start updating the plan on a weekly basis, and apply the financial period at a four-weekly interval.
Please note that the calendar is set for a 7-day workweek of 8 hours every day and that the financial period ends on a Saturday. Now, we are going to do the first update.
But when and how is the best time to do the updates?
My preferred schedule for updating is to do this on a Tuesday morning for the week before .Project team members need time to record the progress of each activity in the schedule and need to record the worked hours for each activity or work package.
We are recording progress.
How to record the progress of each activity of each activity is dependent mainly on the internal procedures for reporting progress. I have sat with each lead engineer behind the screen and went through the activity assigned to him. I have taken the progress from an ERP system, where the progress was recorded. I have made a unique PDF printout for the construction manager, and he coordinated the progress of all the activities within his responsibility.
One thing I did not do was assess the progress myself. Assessing progress by the scheduler or planner is an inferior practice. If the owners of the project activities are not capable of estimating the progress, then they should not be in this role. It is better to have nobody than an imperfect body. The other great challenge is that the project schedule becomes ‘your schedule’. And not the schedule of the project management team headed by the project manager.
Monitoring and controlling resources and costs.
Monitoring and recording of resources and cost expenditure.
Let’s start with the monitoring and controlling of the resources. A good schedule must have all the required resources assigned to the relevant activities, and the expenditure of the resources on these activities must be equally monitored and recorded. If you have access to the Primavera timesheet module, then it should not be too difficult. However, if you use P6 Professional, then you need to be creative and find a method of recording resource hours for labor.
Coding is the answer to good collaboration between the planned and the actual expenditure of project costs. A timesheet model must be developed to meet your goals. The timesheet module should be equal to the recording of worked hours and the payment of these hours.
The monitoring and recording of the assignment of plant and equipment is best done at the cost account level. You can combine the cost accounts with the Level Of Effort or the WBS summary. As a scheduler, your primary focus is not the expenditure of cost for management, indirect cost, plant and equipment cost, scaffolding, financing, insurance bonds, or currency risks. These are activities that are the responsibility of other team members. However, to have a good schedule, these costs must be included in the project schedule as resources and costs.
Again, coding is the answer. I used different code structures, but for clarity, I have used other cost accounts, and you will see them during the updates.
Update week the first week
We have been informed by the workers that the project has commenced as planned and that the progress is as intended.
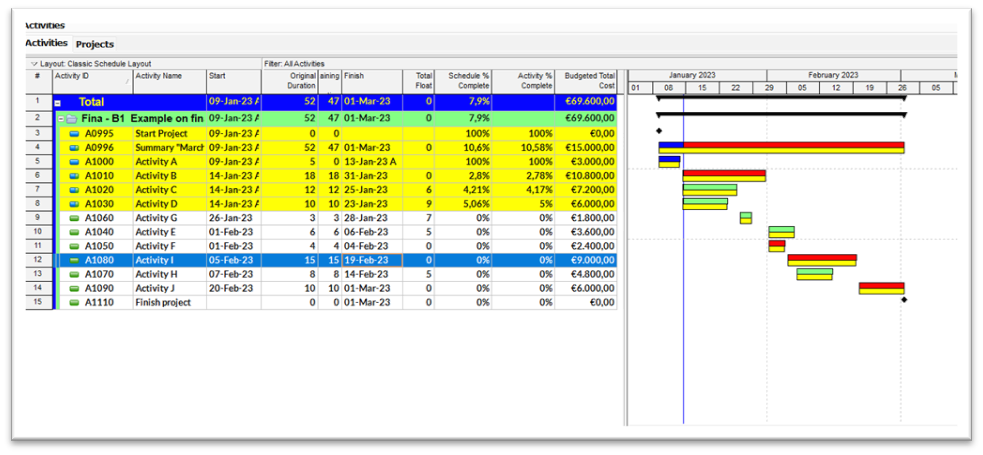
So, in this case, we use the ‘update function’ under the tab Tools, and we set the spotlight and the’ F9 schedule’ equal to the end of the financial period, that is, the end of Saturday.
We have now updated the schedule and noticed that the data date had been changed from the 9th of Jan to the 14th of January and you see the outcome in the next picture.
Update week 2 .
The project is progressing. The lead of activity B reported little progress because one of his team members got ill, and another team member had to step in, but it took a while to pick up the work. The leads for activities C and D progressed as planned. So, let us update the schedule with the new data date of 21 of Jan.
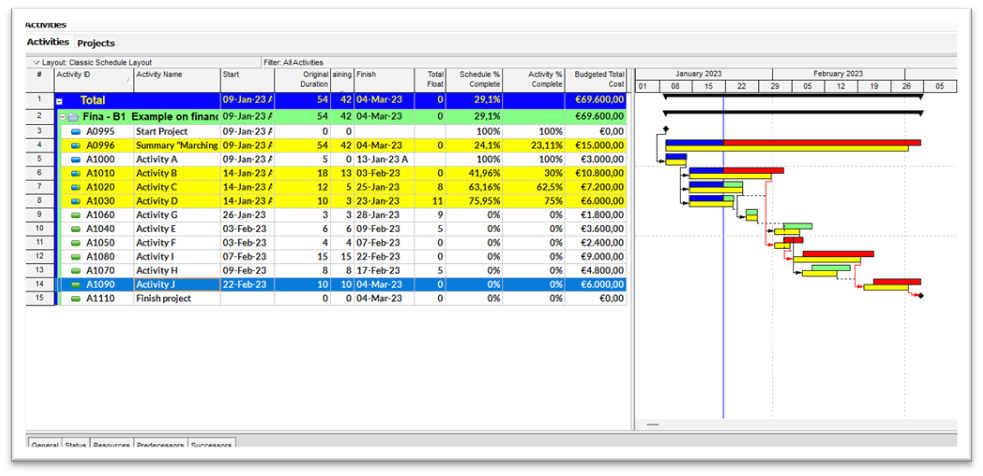
We have updated the schedule and have assigned 30 % progress in lieu of the 41.96 % as scheduled. What you also see is that the schedule has slipped because activity B was and still is on the critical path. Also, note that we have not catered for the cost accounts input. We do this at the end of the financial period.
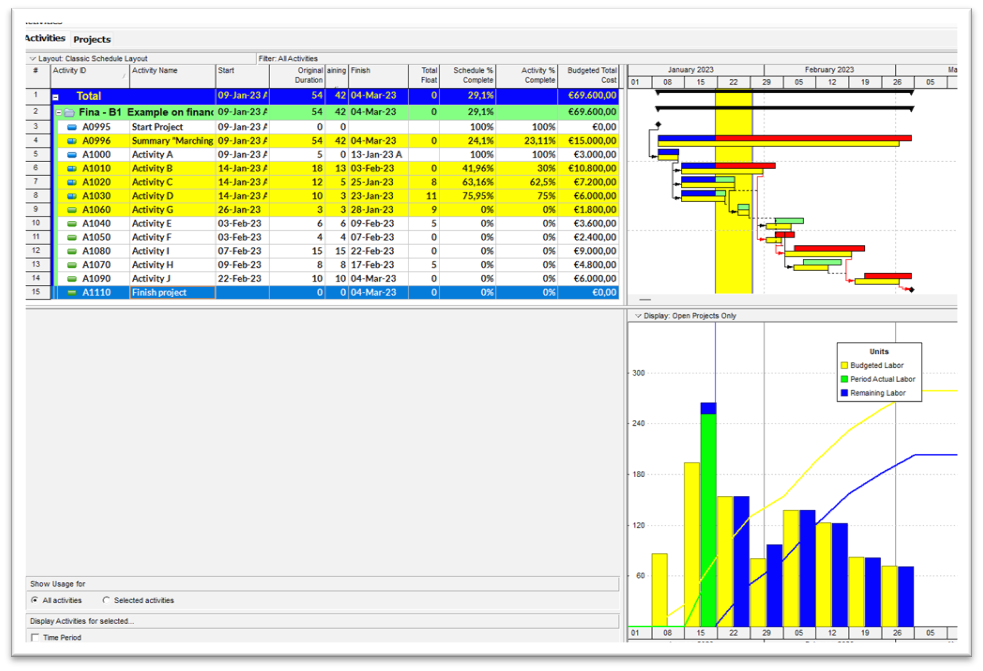
I have included a screenshot with the histogram and the s-curves for the update of the second week. What do you see? Yes, ‘the period of actual labor is not well-updated. We know the solution in the next update!
Update week three of the project.
The project is progressing, and the leads are reporting good progress. This is an example, and we are doing well! Activity B has gone well, and they have improved. This update is the end of the financial period, and we set the data date on Jan 29 .
Hereunder, you see the update with the data date of Jan 29th .What do you see? The project is progressing but is still a little behind schedule. Now, we go to the costs of the project activities. We have updated the cost time hours from all the workers, and we are going to apply the actuals to the activities in the schedule. Hereunder you see the update!
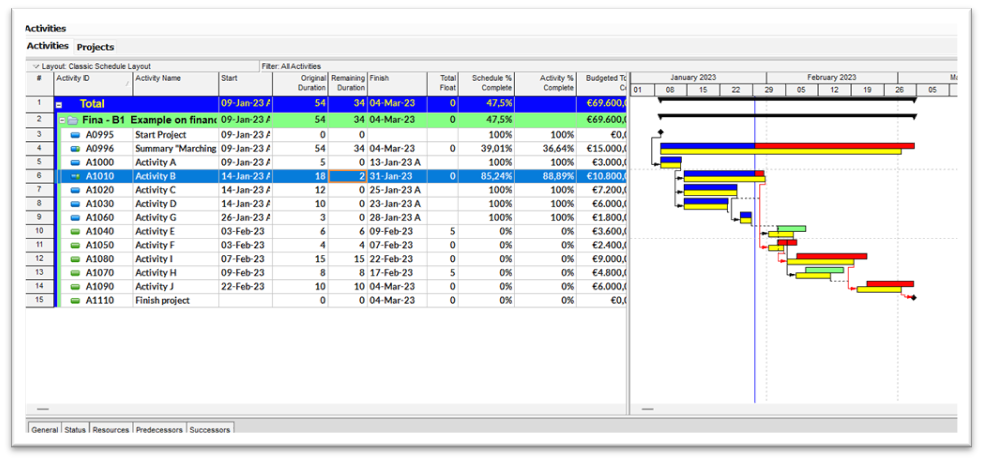
Hereunder, you see the histogram without applying the financial period. Remember, the financial period was scheduled for this period under review!
So, as planned on 29th.
So, you see the histograms without the assignment of the financial period.
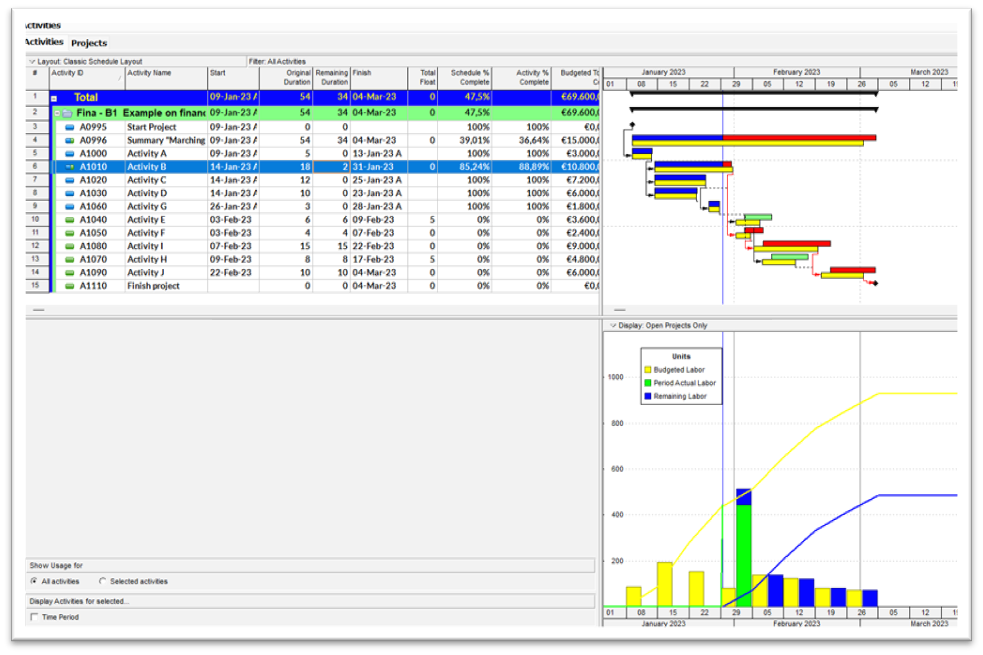
You see that the histogram is not looking good! This is because we have not stored the financial period, but before doing this, we are going to update the cost accounts and the labor expenditures. Here we go!
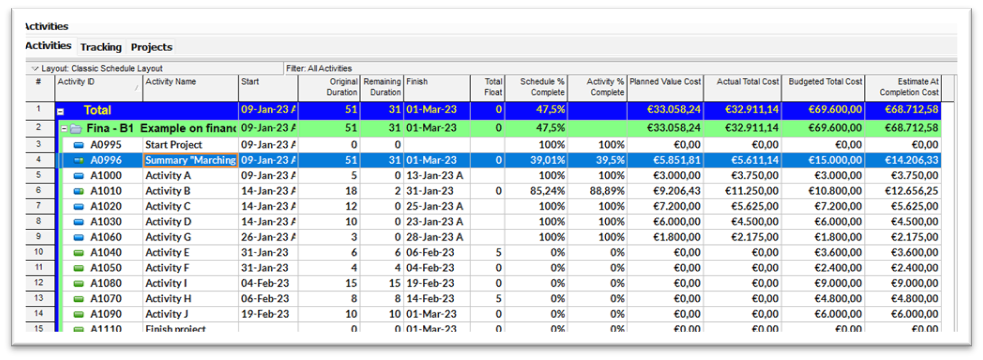
What do we see?
Planned value= 33.058,14 euro
Actual total cost value= 32.911,14 euro
The budgeted cost is as planned=69.900,00 euro
Estimate at completion = 68.712,58 euro
So this looks good!
Now, we are satisfied with the outcome, and we have the consent of the financial controller and, of course, the project manager. We are going to store the financial period.
Storing the Financial Performance
To store the financial performance over the selected period, we go again to the ‘tools tab and set ‘store periodic performance. So, let's do it and see what happens!
Yes, we have stored the period performance, and we see the results hereunder.
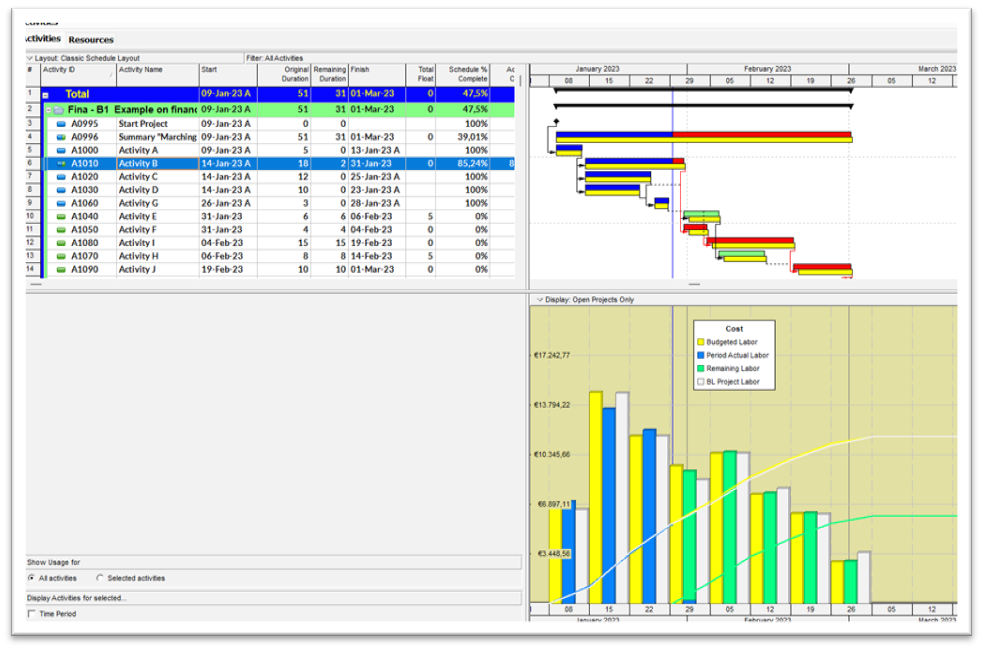
Histogram based on cost
Now, we have a clear picture of the cost and unit expenditure. You can make various selections, but I have opted for budget, period actual labor, remaining labor, and the Baseline project labor.
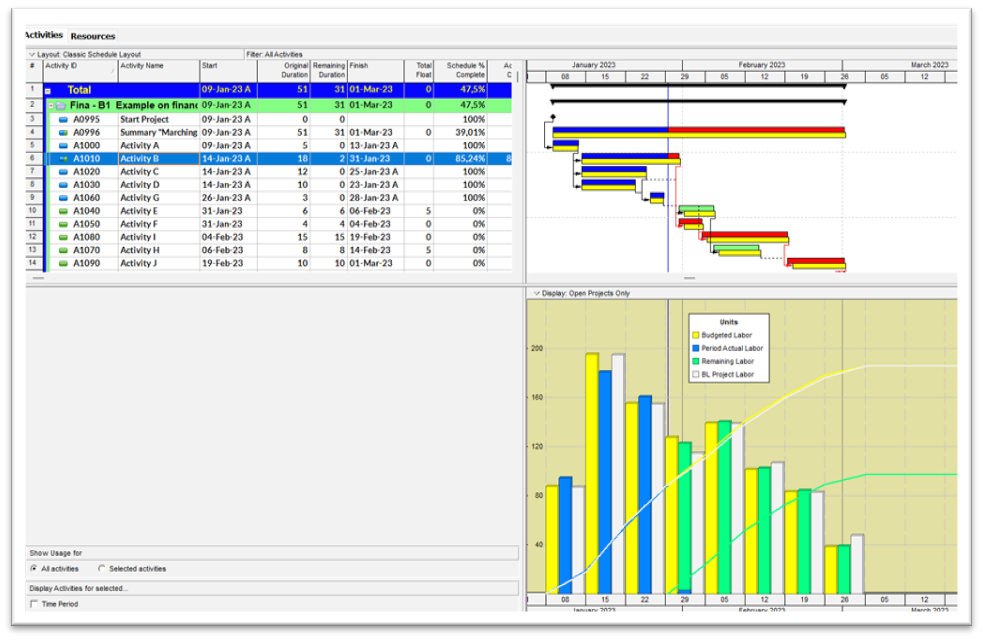
Histogram based on units
You can see that we have a clear and concise picture of the planned and the actuals in the histogram. Can you use it for your presentation? Yes, indeed yes, but for BI and Excel dashboards, we require other data. Now we have many options. Just copy and paste it into Excel.
Copy and past in excel
The first section is about copying and pasting in Excel, and the second section is about using the report function in P6.
Section 1 Copy and paste.
Resource assignments
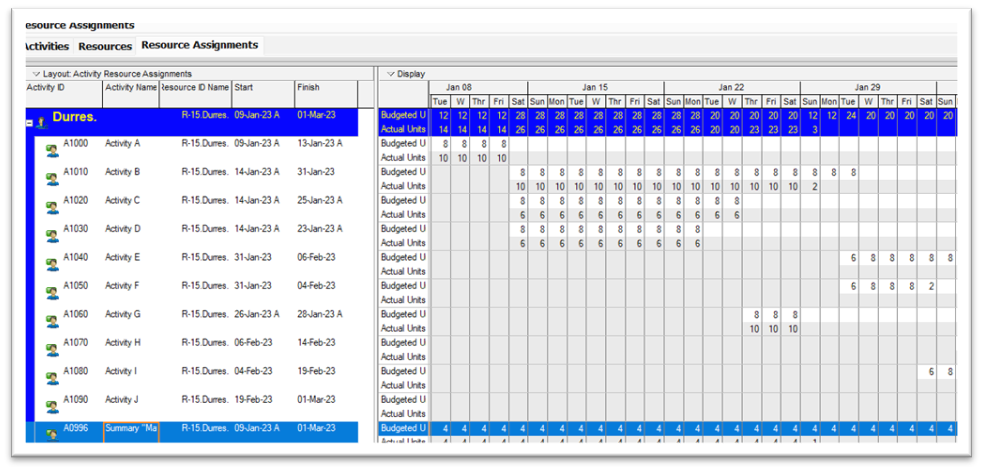
Activity usage spreadsheet.
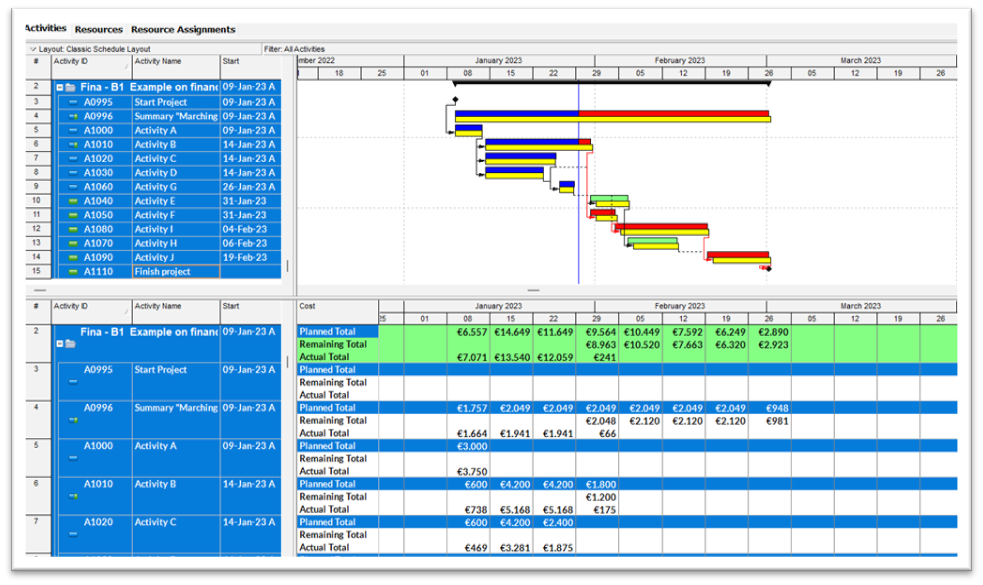
Earned value data

You see Cost Performance Index (CPI), Schedule Performance (SPI), Cost Variance, Cost Variance Index Schedule variance, and much more if you select the appropriate columns.
Cost data per cost account
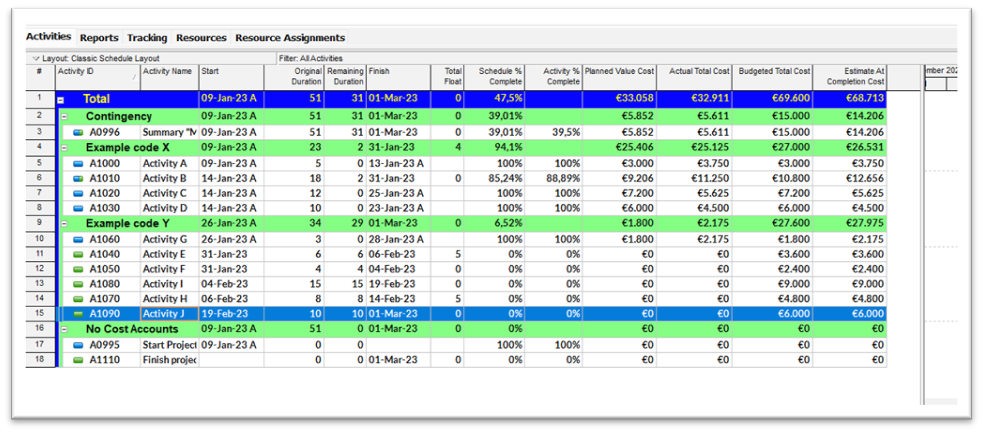
Here, above, you see the group and sort layout on the basis of cost accounts. I have made 3 example accounts: 1 for cost account X, 1 for cost account Y, and one for cost account for contingency, which is standard in my cost accounts. This can be a suitable and adequate basis for cost reporting on the basis of cost accounting.
This is one of the pivotal features of connecting the project data on the basis of cost accounts in lieu of reporting on the basis of the WBS structure. In the next section, you will discover the magic of report writing in Primavera P6. Let us start!
Section 2 Data through reports

This report is a typical report as a starting point for a montly report on the basis of cost control accounting and reporting.
What can you see?
- The cost accounts code
- The resource code
- Cost account name/ activity code
- Activity name
- Planned units
- Actual units
- Remaining units
- Planned cost
- Actual cost
- Remaining cost
Data in Excel
Would you like to discover this report in Excel? No problem, just configure it from CSV to Excel.
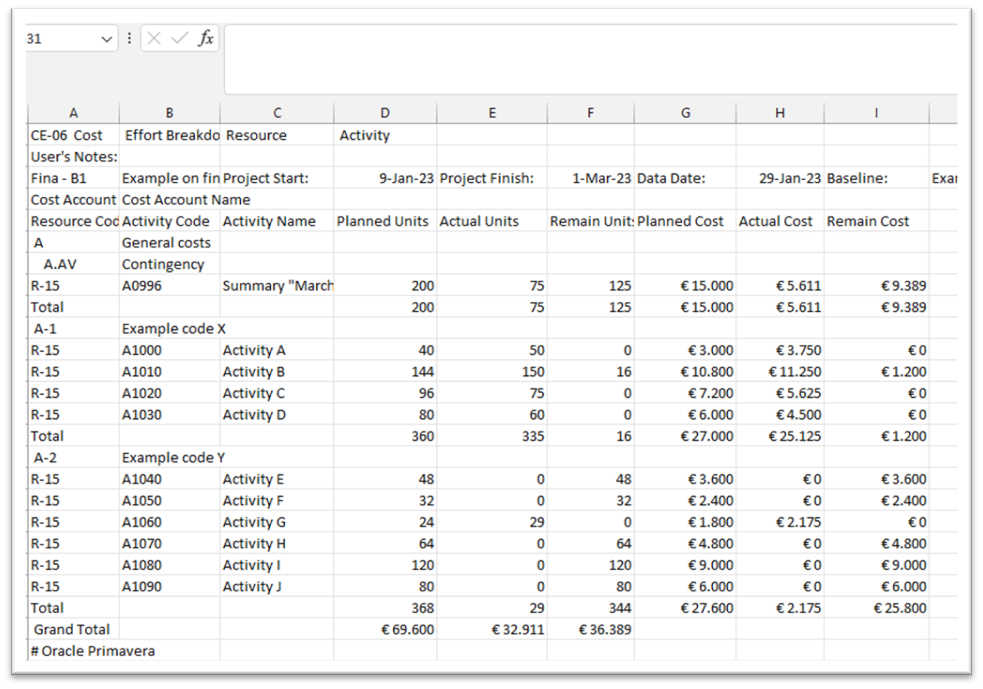
In the reports function, we have a large selection of reports to suit our requirements.
Summary
As I stated at the start of the article ,
The purpose of this article is to demonstrate how the financial Period feature can be utilized in Primavera P6.
I trust that I succeeded in the purpose of exploring and delving into the financial periods with this article. I enjoyed it very much and I hope that this article contributes to the project management and project control community.
Jan van den Berg
I
